Upload a workspace
The compiled kernel and, if you have them, its source, a launch manifest and input tensors.

MarsTrace Early access
MarsTrace is kernel tracing as a service. Upload a CUDA kernel and say what you want to see. An agent runs it on an NVIDIA H200, B200 or B300 and returns a timeline of what happened inside, warp by warp.
How it works
You do not need the GPU, the tracing tools or the time to set either up. A job takes four things from you and gives one file back.
The compiled kernel and, if you have them, its source, a launch manifest and input tensors.
A prompt in plain language: which kernel, which region, and the question you want answered.
An H200, a B200 or a B300, and the CUDA toolkit version the job should run with.
One file, marstrace.json. Open it as a timeline in
the console, or hand it to your agent as text.
Inside a job
Each job gets its own GPU machine for as long as it runs. An agent instruments the compiled kernel, launches it and records when each part of it ran.
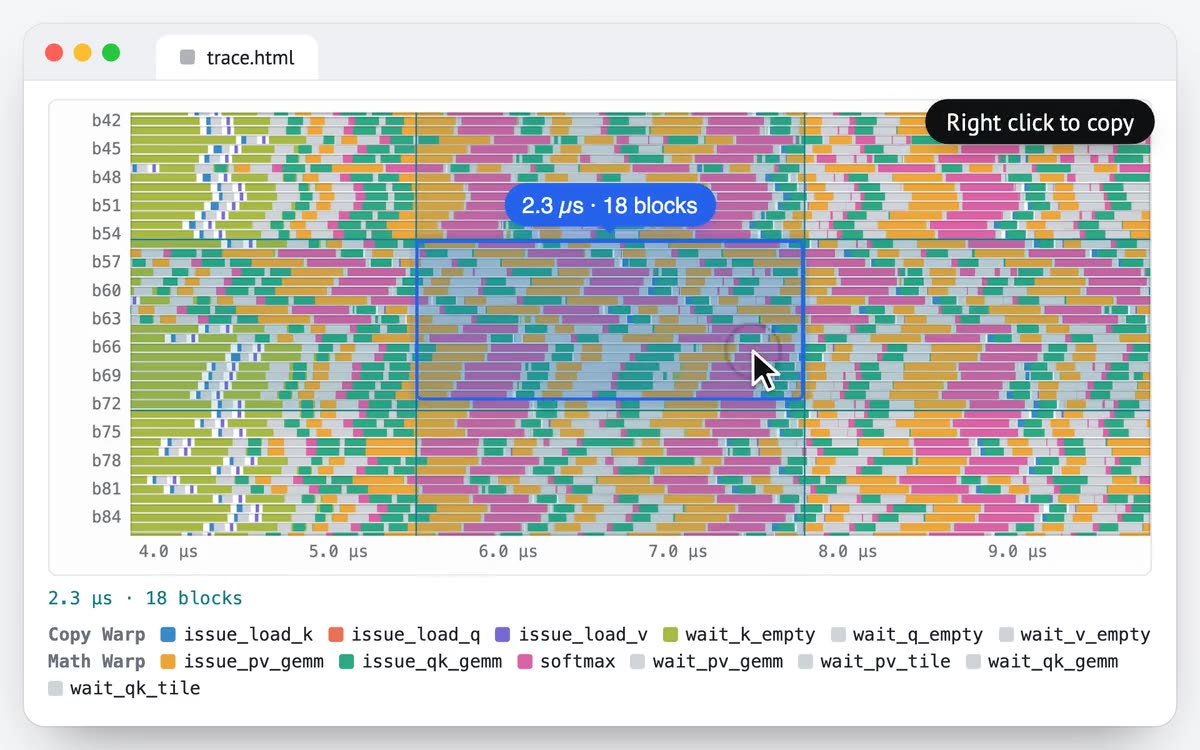
Three ways in
The marstrace client prices a job with
estimate, sends it with submit and
opens the result with show.
MarsTrace speaks the Model Context Protocol, so an agent can submit a trace, wait for it and read the result on its own.
Jobs, keys and usage sit beside your Token Factory workspace. A job opens on its trace, by thread, warp or block.
Why it can be trusted
MarsTrace is built on Xtrace, the tracer in G-Watch. It adds its probes after compilation, so the compiler never sees them and the kernel stays the one you built.
A trace is a measurement. It is useful only if the kernel being measured stays the same. Probes added before compilation change how the compiler schedules the code, and a stage can look slow only because the probe made it slow.
Ranges across the kernels tested, on NVIDIA H100 and B300 and AMD MI300X. Source: G-Watch, September 2026.
At a glance
MarsTrace is open to a first group of teams while we finish it. Tell us about the kernel you want to see inside, and we will set your workspace up.
marstrace.json, with a timeline and
statistics
See how agents turn traces into faster kernels, and the results we have published so far.