
MarsRover On request
See what a GPU is really doing.
MarsRover is our analysis framework for GPU execution. It brings together MarsTrace, binary analysis and microbenchmarking, and gives engineers and their coding agents exact data to optimize with, on NVIDIA and AMD hardware.
Built for agents
Ask your agent where the kernel stalls. It can find out.
A coding agent that sees only totals has to guess. With MarsRover it traces the kernel, reads the timeline and tests its change.
- MarsTrace. A timeline of every warp inside a kernel, traced on the compiled binary.
- Binary analysis. What the compiler really emitted, down to the instruction.
- Microbenchmarking. Small, targeted measurements that test an idea before a kernel is changed.
- Agent skills. Ready-made skills teach an agent to trace, to read a trace, and to ask for a region when the totals are not enough.
Trace the attention kernel in bench.py and find where it stalls
Skill(marsrover-cuda-intra-kernel-tracing)
Bash(python bench.py --trace trace.json) Wrote trace.json
Bash(marsrover show trace.json --bubbles) Longest bubbles: producer warp, before each KV load
The producer waits for a free KV slot before every load, so the mainloop stalls. A third pipeline stage should hide it.
Update(attention.py) - kv_stages = 2+ kv_stages = 3
Bash(marsrover show trace.json --bubbles) The producer no longer stalls the mainloop
An illustration of one session, from the MarsRover quick start.
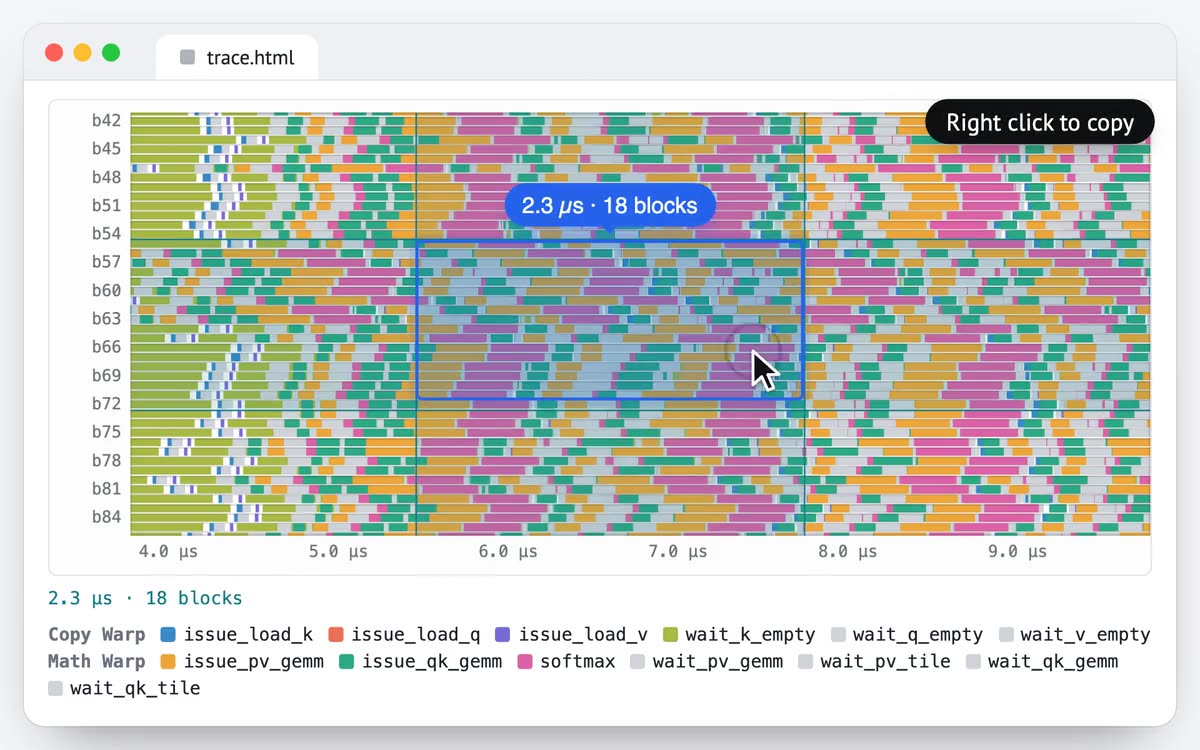
One trace, two readers
A panel for people. Text for agents.
The same trace renders two ways, and a selection carries a region from one to the other.
- For people. An interactive timeline in one self-contained HTML file. Zoom from thread block down to thread.
-
For agents.
marsrover showprints the same trace as text: statistics, the longest waits and a timeline per thread. - Between them. Mark a region in the panel, copy it, and the agent reads back exactly that region.
MarsTrace
Trace the kernel you ship, not a different one.
A trace is a measurement. It is only useful if the kernel being measured stays the same.
Existing tracers add probes before the kernel is compiled. The compiler treats them as part of the kernel, schedules the code differently, and some optimizations disappear. MarsTrace edits the compiled binary and fits each probe into room the kernel leaves unused. It changes no basic block.
Original instructions still in the traced kernel
Time added to the kernel
Ranges across the kernels tested, on NVIDIA H100 and B300 and AMD MI300X. Source: MarsRover, September 2026.
Closed-source kernels too
MarsTrace needs the binary, not the source. That opens up the kernels inside vendor libraries.
19 GPU architectures
Both vendors, from the newest parts back several generations.
Six kernel languages
However the kernel was written, the trace is taken the same way.
Open Traces
Real traces, open in your browser.
We publish traces of open and closed-source kernels. Each one opens as an interactive timeline, warp by warp.
Software traced so far
See what the tools found.
Published gains on FlashAttention kernels, with the conditions each was measured under.